
 Source: EPA, 2013
The City of Orlando has a population of 255,000 and a greater metropolitan area containing two million inhabitants. The city, fifth largest in Florida, has experienced a 7% annual population growth over the last four years (U.S. Census Bureau, 2014). Despite a vibrant economy, the city has significant portion of poor and elderly populations. These groups are spatially distributed accross the city and are the most susceptible to climate change hazards thus requiring the City of Orlando to implement climate adaptation plans to protect these vulnerable populations.
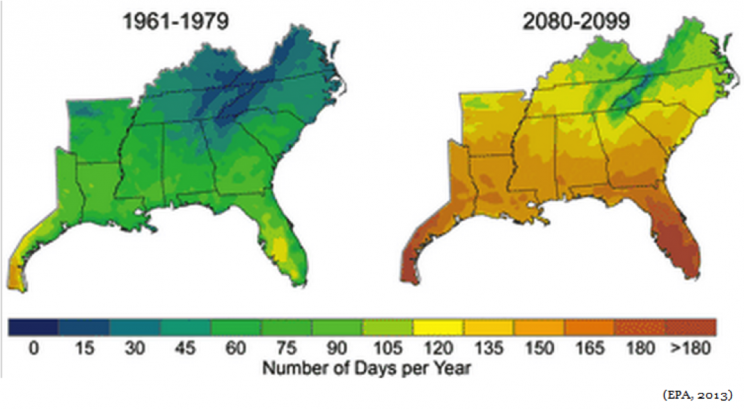
Climate hazards for Orlando include a projected rise in the average maximum temperature to 90 F (USGS, 2014) and an increased in frequency and intensity of precipitation events with an upward trend of total precipitation by the year 2100 (USGS, 2014). These factors will intensify the heat island effect (see figure) and contribute to flooding from storm water run-off.
The vulnerable groups, comprising nearly one-third of the population, include the elderly (9.5%) and poor (18.4%) (City Data, 2012). While many of the lower income residents are located in the urban center, both populations are scattered throughout the metropolitan area thus requiring city-wide response strategies. Compounding geographical vulnerabilities include Orlando’s geographic location in a low-lying drainage basin, reduced soil’s moisture retention capacity (Adler and Hostetler, USGS, 2014), and extensive impervious urban landscape.
Mayor Buddy Dyer initiated a climate change response plan in 2007 which analyzed greenhouse gas emissions and set reduction targets. This initiative, Greenworks Orlando, has made significant progress to mitigate carbon emissions. The City of Orlando is willing and able to create climate change response programs, however the current plan focuses entirely on mitigation and do not sufficiently address climate change adaptation. To address the vulnerabilities of the city, Orlando should focus on policies such as:
I. Ecologically sensitive building codes: A change to city building codes and ordinances would require future construction and redevelopment to include bioswales, pervious pavements, green roofs, and increased city green spaces. These changes would create vegetated catchment throughout the city, significantly reducing stormwater runoff, flooding and the urban heat island effect.
II. Energy Peak Management: Through a partnership between the Orlando Utilities Commission and City of Orlando, a peak demand response mechanism can work to incentivize lower energy use during peak demand periods, thus reducing the likelihood of blackouts and increasing the resilience of the power grid during heat waves.
These policy mechanisms will contribute to the reduction of heat related health risks in the poor and elderly populations, while generating incentives for energy use reduction and increasing ecologically sensitive economic development opportunities in the city. The inclusion of new building codes and strategies and a peak demand response mechanism both contribute to these outcomes and will help the city meet carbon mitigation goals already in place. Greenworks Orlando plans are scheduled to be updated in 2015 and 2016, and significant opportunity exists to incorporate climate adaptation policy into new and existing programs.
The figure above shows the observed and projected number of days per year over 90 degrees and illistrates the impact of climate hazards on the City of Orlando. (EPA, 2013).
This article is a product of Professor Shagun Mehrotra’s Climate Change and Cities class. Analysis is based on the Framework for City Climate Risk Assessment and Climate Change and Cities:First Assessment Report of the Urban Climate Change Research Network. Views expressed are entirely those of the authors.
References
Alder, J. R. and S. W. Hostetler, 2013. USGS National Climate Change Viewer. US Geological Survey. http://www.usgs.gov/climate_landuse/clu_rd/nccv.asp
City-Data. Orlando, Florida (FL) Poverty Rate Data. 2012
http://www.city-data.com/poverty/poverty-Orlando-Florida.html
U.S. Census Bureau. (2014, July 8). State & Country Quickfacts: Orlando, Florida. http://quickfacts.census.gov/qfd/states/12/1253000.html
USGS, 2014. National Climate Change Viewer. US Geological Survey.
http://www.usgs.gov/climate_landuse/clu_rd/apps/nccv_viewer.asp
US Environmental Protection Agency. Southeast, Impacts on Human Health, 2013
http://www.epa.gov/climatechange/impacts-adaptation/southeast.html